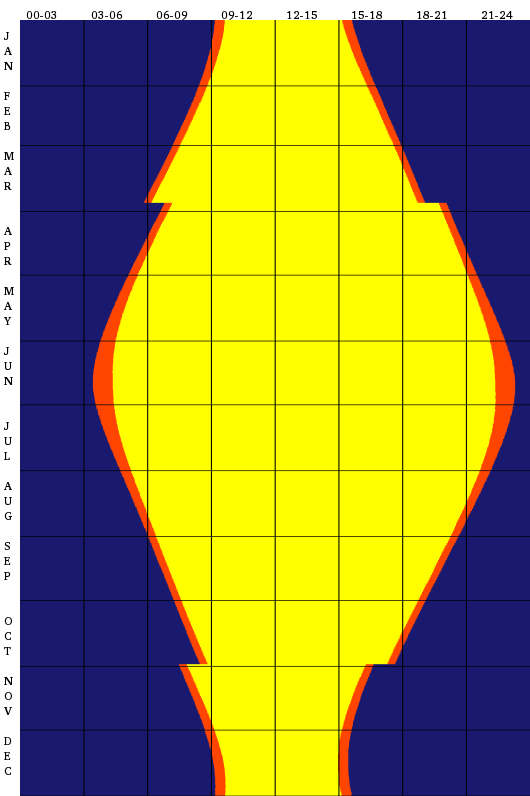
I tried to find a diagram with the distribution of daylight over the course of a year in Helsinki but couldn’t, so I made my own. Shockingly, my little Python script worked the first time I ran it:

The sudden jump in the line is due to daylight savings time.
Blue means night, orange means dawn/dusk, yellow means day. The left and right sides are midnight, the middle is midday. Top and bottom are New Year.
Here’s one with 06:00, 12:00 and 18:00 marked with a black line:

I can make bigger ones if someone wants them, or you can roll your own. I used a dataset I found on the web and wrote a Python script to generate the image. You need to have the Python Imaging Library installed for it to work.
# Generate daylight diagram. This produces quite a large file, # size is controlled by pixels_per_min and day_width. import Image, ImageFile, ImageDraw from ImageColor import getrgb data_file_name = "daylight-data.txt" output_file_name = "daylight.png" pixels_per_min = 1 day_width = 6 line_width = 2 light_color = getrgb("yellow") dark_color = getrgb("midnightblue") twilight_color = getrgb("orangered") line_color = getrgb("black") def h2min(s): hours, minutes = int(s.split(":")[0]), int(s.split(":")[1]) return 60*hours + minutes def min2px(flt): return int(round(flt*pixels_per_min)) # data file, formatted "date - sunrise - sunset - length of dawn+dusk" f = open(data_file_name, "r") data = [[h2min(line.split(" - ")[i]) for i in range(1,4)] for line in f.readlines()] size = int(round(24*60*pixels_per_min)), len(data)*day_width image = Image.new("RGB", size) draw = ImageDraw.Draw(image) for day in range(len(data)): y_top, y_bottom = day*day_width, (day + 1)*day_width twilightmargin = data[day][2]*0.25 daystart = 0 darkstop = dawnstart = min2px(data[day][0] - twilightmargin) dawnstop = lightstart = min2px(data[day][0] + twilightmargin) lightstop = duskstart = min2px(data[day][1] - twilightmargin) duskstop = darkstart = min2px(data[day][1] + twilightmargin) midnight = size[0] def fill(left, right, color): draw.rectangle([(left, y_top), (right, y_bottom)], color) fill(daystart, darkstop, dark_color) fill(dawnstart, dawnstop, twilight_color) fill(lightstart, lightstop, light_color) fill(duskstart, duskstop, twilight_color) fill(darkstart, midnight, dark_color) def vline(percentage): pos = int(round(size[0]*percentage)) draw.line([(pos, 0), (pos, size[1])], line_color, line_width) # uncomment to draw vertical lines at 06:00, 12:00 and 18:00 #vline(0.25) #vline(0.5) #vline(0.75) image.save(output_file_name) |
edit: I made one with more markers so it’s more useful but less pretty:

aika rivo kuva.
veikko
pah
sam
Nice diagrams.
I have found one online daylight graph for Helsinki here:
http://www.gaisma.com/en/location/helsinki.html
janka
CSC on tehnyt noita jo pitkään:
http://www.csc.fi/csc/julkaisut/graafinenallakka
Sampo Smolander
pah :(
sam
On kyl todella hieno toi CSCn!
sam