What would a conference built around the computer graphics industry be like? Pretty boring, right? There’d be talks on eking out another million triangles per second or whatever they do these days, with boring engineers talking about slightly larger and faster registers and pipelines so kids can play slightly more elaborate computer games or whatever. Dead wrong. That conference is SIGGRAPH (Special Interest Group on GRAPHics and Interactive Techniques) and it’s batshit insanely cool.
The most shocking thing about innovations in computer graphics (understood pretty widely, mind) is that they’re so simple and obvious once you hear about them. You really notice that as a field of study it’s actually pretty young. Example: content-aware image resizing. It was presented at SIGGRAPH 2007 and it appears to be a totally novel and simple idea about how to naturally destroy or create information in images.
It works something like this:
1) Detect edges in the image (borders between areas of colours). There are numerous algorithms to do this.
2) For each pair of pixels opposite each other at the top and bottom of the image, find a path from one to the other that crosses the least edges in the image. This is called the least-energy path and it contains “the least information”. (Everything works the same way if you want to destroy/create horizontal lines, just use pixels at the sides).
3) If you want to reduce the image horizontally, remove paths (the previously computed least-energy ones) from the image starting from the one with the least energy. To enlarge the image, take the path with the most energy, compute the average of that and its highest-energy neighbour and insert it between them.
Pretty simple, right? And does it work well? Like magic. The video has numerous interesting details I omitted here.
Now, this is more cute than really interesting, but still: what do you think this inequality describes?
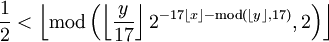
(the square brackets without tops represent the floor function)
Well, the outermost modulo operation is of the form mod( f(x,y), 2 ) so perhaps it codes information from x and y into bits somehow. Almost, but not quite. Let n be an integer and graph the points for which the inequality is true in the plane-slice 0 < x < 106 and n < y < n + 17. This will draw information contained in n - in fact an arbitrary image that fits into a 105x16 grid. For n = 9609393799189588849716729621278527547150 0433966012930665150551927170280239526642 4689642842174350718121267153782770623355 9932372808741443078913259639413377234878 5773574982392662971551717371699516523289 0538221612403238855866184013235585136048 8286933379024914542292886670810961844960 9170518345406782773155170540538162738096 7602565625016981482083418783163849115590 2256100036523513703438744618483787372381 9822484986346503315941005497470059313833 9226497249461751545728366702369745461014 6559979337985374831437868418065934222278 98388722980000748404719, the inequality describes a little picture of the formula of the inequality itself:
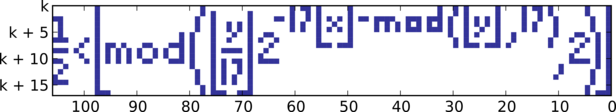
As I say, cute. This and more is detailed in a SIGGRAPH paper here.
